Featured Modeler: Sami Araboghli
Wednesday, March 31, 2010
When Sami first started using Google Earth, he noticed lots of 3D buildings popping up and wanted to see his own models appear. After finding Google SketchUp, he started investigating how to take the models from his computer and share them with everyone else in Google Earth. After his first effort was not accepted for inclusion, Sami started researching ways to improve his models. He now has 29 3D buildings (and counting) accepted into Google Earth’s default 3D Buildings layer.
Sami starts his modeling experience by using Google Maps to find a building that interests him. In most cases, he hasn’t physically visited these locations; Sami uses Street View in Google Maps to acquire the imagery he needs (this video shows how). The first model he created with this method was a Citroën car dealership in Prague, Czech Republic.
Sami says: “I want to be heard, and to tell people that anyone -- no matter how old you are -- can put buildings on Google Earth and they too can be heard.”
Sami describes Google SketchUp and Google Earth as his favorite software applications; sometimes he spends the entire day making buildings. He loves the idea of being able to put buildings in Google Earth and share them with friends. Says Sami, “I think it was one of Google's coolest ideas.”
Sami also told us that he will be in the National Geographic Florida State Geography Bee competition on April 9th. Good luck Sami!
Explore the world with new iGoogle themes
Tuesday, March 30, 2010
Today the iGoogle team announced a new set of themes designed for the world traveler in all of us. There are 25 themes that highlight places around the world and include beautiful scenery, historic monuments, exotic beaches, iconic cities, and breathtaking sites.
In addition to partnering with National Geographic Society, LIFE, Lonely Planet, UNESCO, and visiteurope.com to bring you the stunning imagery featured in most of the themes, we also created a couple of themes using imagery from Google Earth.
The 3D Cities in Google Earth theme puts you in the middle of the action in New York City and Tokyo. It transports you to the ancient ruins of Athens, Greece, and takes you down under to Melbourne, Australia. It also gives you a glimpse into the historic architecture of Budapest, Hungary; Copenhagen, Denmark; and Vienna, Austria.
 The 3D Views in Google Earth theme gives you a birds-eye view of a couple of natural wonders in the Unites States -- the Grand Canyon and the Great Lakes. It transports you to the last of the remaining Seven Wonders of the Ancient World -- the Great Pyramid of Giza in Egypt. And you can view the stunning architecture of the Taj Mahal in India. Lastly, relax in Positano, Italy, or Bondi Beach, Australia.
 We hope that you enjoy our new iGoogle themes and that they’ll help inspire you to keep exploring the world around you.
Posted by Anita Barci, Product Marketing Manager
Tour the March Madness arenas in 3D
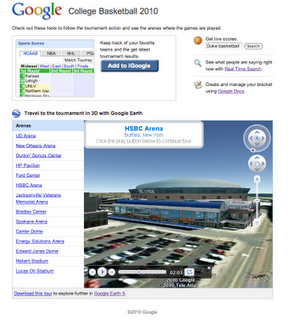 Here at the SketchUp office, we gathered 14 models of the arenas and added them to a Featured Collection. These models are located all over the country, and largely created by users like you. Especially cool is the model of the Energy Solutions Arena in Salt Lake City, where you can fly inside and see the interior of the model! Both the Edward Jones Dome and the HSBC Arena are great examples of high quality photo-texturing, and the Lucas Oil Stadium in Indianapolis was created using Google Building Maker.
We also put together a 3D tour (kml file) of these arenas for Google Earth 5. You can see the relation of the cities to one another and explore the surrounding 3D models. Creating a tour like this is a snap with the touring feature in Google Earth 5.
So explore the collection, enjoy the tour and hopefully rejoice in how well your bracket still looks.
Posted by Adam Hecht, 3D Data Specialist
Dortmund, Germany in 3D
Friday, March 26, 2010
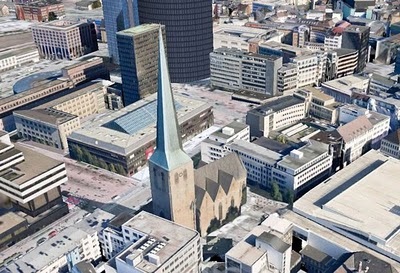
Like many medieval cities, Dortmund is punctuated with churches and other relics that have a history dating back to the Holy Roman Empire. An example would be the Petrikirche (St. Petri Church), which was built in the middle of the 14th century. The church was modeled by geo-modeler “chrischibuilder” using Google Building Maker.
The tallest structure in this northern German city is the Florianturm, a TV tower with a height of 219.6 metres that sits at the center of the Westfalenpark. The tower was modeled by geo-modeler “Zeitreise Ruhr” using Google SketchUp. Watch our video to fly to the tower and other landmarks in Dortmund. We invite you to start exploring Dortmund in 3D!
Posted by Bruce Polderman, Product Manager
Using SketchUp to create hand renderings
Wednesday, March 24, 2010
At Michelle Morelan Design, we offer a full range of Interior Design services: interior planning and design, renovations, and project management. You can choose from full design services or e-design.
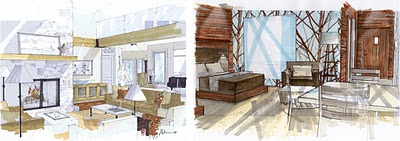
We use SketchUp from importing site dimensions through schematics and design, and onto working drawings. The great thing about SketchUp is it gives you instant feedback. What would the accents look like in red?...where should I put them?…how long and thick should this wall be?…even what it looks like to walk from one space to another. It also blurs the line between schematic and working drawings, because you build and design to scale. This means you can use the same model for working out the design as for contract documents or working drawings, saving lots of time. With the use of a section plane, by turning off the perspective view and adding dimensions, you take the drawing to that next level.
One thing that's different about the way we use the software are the hybrid drawings that have become our specialty. Our firm has created a niche by building 3D models and rendering perspectives for other designers and homeowners, as well as creating stunning and precise visuals for our own firm’s presentations. Continue reading...
Posted by Chris Cronin, SketchUp Sales Team
Moving dimensioned model views in LayOut
Monday, March 22, 2010
If you've dimensioned a SketchUp model view, things can get trickier. Since each dimension is technically a separate element, and since dimensions are connected to the underlying geometry in your model, moving things requires you to be a little more intentional about what you intend to move:
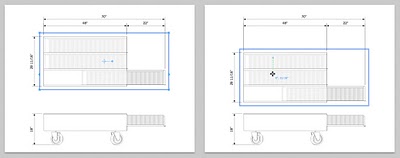
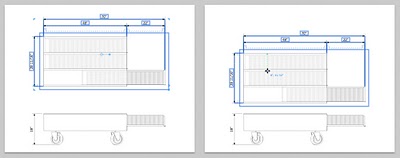
Selecting and moving just the model view causes any associated dimension to do everything it can not to move. Extension lines (leaders) stretch and shrink to stay connected to the model, but the rest of the dimension tries to stay put. See below:
Selecting the model view AND its associated dimensions THEN moving everything causes everything to stick together as a single mass; most of the time, this is the behavior you're after. Here's what I mean:
For this reason, I like to group together (right-click > Group) model views and their associated dimensions to keep things tidy. To edit a group, just double-click.
Posted by Aidan Chopra, SketchUp Evangelist
Green design in the Mt. Annan Botanic Garden
Friday, March 19, 2010
The Bowden Centre is a new educational and multipurpose resource building at Mount Annan Botanic Garden, Sydney NSW. The building’s primary purpose is to provide a teaching facility for the numerous school groups who visit the garden every year -- a place to learn about the garden and Australian flora. However, the facility has also been designed to accommodate a broad range of other activities, from seminars to weddings.

The brief for the project, the first permanent building at the Botanic Garden, was to set the benchmark for future buildings on the estate and to provide a unique multi-function facility that demonstrates high standards of ecological sustainability, within a very modest budget.
This was achieved through, amongst other things, siting the new building in the location of an existing structure, recycling the steel structure and aluminum windows from the earlier building, the use of low maintenance materials, the thermal management of the building via a ground coupled, water based air conditioning system and the inclusion of a series of plywood clad, vertical wall openings that act as alternatives to conventionally glazed windows.

What prompted us to spend the time building the SketchUp model was that we were preparing a talk about the building and wanted a method to explain concepts behind the building design. We set upon using the SketchUp animations as a way of bringing these concepts to life, particularly through the use of the sectional animations. We now regularly use SketchUp animations as a presentation tool to present models built in our CAD package.
Posted by Chris Cronin, SketchUp Go Green Team
Shooting for three: Keeping up with the Madness
Thursday, March 18, 2010
Do you feel it, sports fans? Has the anticipation fully gripped your college basketball soul? It's definitely got my attention. Therefore I've embarked on my third consecutive journey into mapping the NCAA College Basketball tournament. This may have caused a bit of personal March madness - a lot of long nights and triple-checking each arena placemark - but I hope you’ll enjoy the result. I’ve made a Google Earth KMZ file that includes the home arenas of the field of 65, and the 14 tournament venues. Each entry in the field of 65 is color coded by region and the game sites have a special basketball icon this year.
You may wonder why I’ve kept this up for three years. Well, aside from the fundamental fact that I'm a college hoops nut, I just so happen to also love seeing the geo-spatial distribution of the teams. The research and compliation of the information led me to several interesting facts you can see for yourself in the layer and then use to wow your friends, such as:
- There are two first-round matchups that pit two teams which have the same mascots
- Bears, Eagles, Gophers, Grizzlies, and Lions have a common trait: they are all 'Golden'
- This year’s tournament is quite colorful: Blue Devils, Mean Green, Orangemen, Big Red, and Yellow Jackets
This My Map also shows you all the key locations for the Madness, color-coded for your viewing pleasure. The East division is indicated by a blue pin; South with green; Midwest with red; and West with cyan. The pins with a dot in the center tell you who the #1 seeds are. View the College Basketball Tournament 2010 in a large map.
Travel to the tournament without leaving home! All 14 arenas are in the “3D Buildings” layer in Google Earth, ready for you to explore. Take a tour of these 3D models by watching the video below or download this kml tour and open it in Google Earth 5. Be sure to check out the Energy Solutions Arena in Salt Lake City -- even the court is modeled.
Also, teaming up with a few other March Madness enthusiasts, we’ve created a page, google.com/collegebasketball2010, where all of you basketball fans can find additional Google tools to help you track the tournament. Keep up with your favorite teams and get up-to-date information on scores, schedules, and brackets with our iGoogle gadget. By doing a quick search for your favorite team, you can see live scores. If you haven’t already made a bracket, check out our Google docs tournament bracket template to help you create and manage your pool in an online spreadsheet. You can also see real time search results so you never miss any March Madness news or chatter!
For all the times when I can’t be planted in front of my television watching the action (or during those pesky commercial breaks), these tools will keep my head in the game!
Posted by Adam Hughes, Google Apps Senior Strategist and College Hoops Fan
Towns galore!
Wednesday, March 17, 2010
Posted by Allyson McDuffie, Google Model Your Town Competition Team
Using Scenes to control layer visibility
Tuesday, March 16, 2010
This time, I'm going to focus on a faster (some might say smarter) technique for controlling the visibility of elements in your models: You can use Scenes to hide and unhide things without having to go anywhere near the Outliner or Layers dialog boxes.
The key to using all of the deliciousness built into Scenes lies in expanding the Scenes Manager (Windows > Scenes) to reveal its extra functionality; the part we're interested in is the "Properties to Save" section at the bottom:
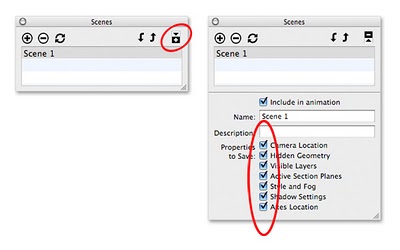 Click the Expand toggle in the upper-right corner to see the rest of the Scenes manager. The "Properties to Save" section lets you determine which display settings each scene should remember.
You can customize a scene you've created by telling it which properties (display settings) it should save. Just select a scene in the list at the top the Scenes manager (single-click to select it), then choose which properties you want from the list. There's no "save" or "update" button to press; a setting is automatically saved as soon you select its checkbox.
Example
Consider the simple building I created for a previous post. In it, I created a layer specifically for all of the furniture in my model. For this example, I’ve added another layer to contain all of the elaborate trees I’ve added. Isolating the geometrically-complex parts of my model on separate, discrete layers makes them easier to hide when I want to boost my computer’s performance and get a better view of what I’m working with. See below for the updated, leafier model:
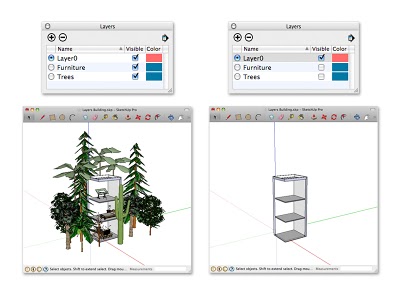 Placing "heavy" stuff like furniture and trees on separate layers makes it easier to hide everything quickly.
I’d like to use Scenes to turn on and off my Furniture and Trees layers without having to access the Layers manager. To do so, I make two new scenes which will each have only one saved property: “Visible Layers”. Here’s how:
- Open the Scenes manager (Window > Scenes) and expand it by clicking the toggle in the upper-right corner.
- In the Layers manager (Window > Layers), turn off all the layers you want to control with a scene. (In this case, Furniture and Trees)
- Create a new scene by clicking the Add Scene (+) button.
- Name the new scene “Entourage OFF”.
- Make sure only “Visible Layers” is selected in the list of Properties to Save.
- Turn on the layers you turned off in Step 2.
- Repeat Steps 3 through 5, naming the newest scene “Entourage ON”.
Now all I have to do to hide my furniture and trees is click the “Entourage OFF” scene tab at the top of my modeling window. Since the only property saved by that scene relates to which layers were visible when it was created (or updated), no other display properties are affected by activating the scene. To turn everything back on, I click “Entourage ON”.
Feel free to download the model (SketchUp model) and try it yourself. Open the Layers and Scenes managers to see how everything’s rigged up.
Posted by Aidan Chopra, SketchUp Evangelist
Final Maintenance Release for SketchUp Pro 6
Friday, March 12, 2010
For those of you keeping count, this is the sixth maintenance release we’ve done for SketchUp 6 since it launched in January 2007. That’s been just over three years that we’ve been maintaining SketchUp 6, and it is time for us to move on. From this point forward, we’re focusing all our attention on SketchUp 7 and beyond.
If you’re still using SketchUp Pro 6, I hope you’ll consider upgrading to SketchUp Pro 7.1. Upgrades cost $95, and we can get you up and running with a minimum of fuss on our latest, fastest and most stable release ever.
Posted by John Bacus, SketchUp Product Manager
Barcelona in 3D
Thursday, March 11, 2010
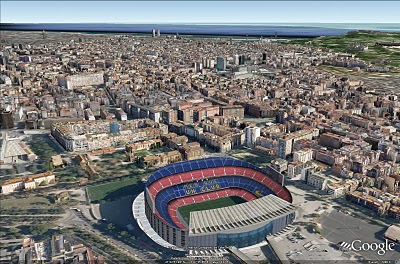
Today, Barcelona joins its Spanish neighbors Madrid and Valencia as 3D cities in Google Earth. If you’re a fan of architecture, Barcelona offers a visual feast. The mix of old and new is truly facinating. It contains architectural wonders that date back to medieval times, in addition to modern architecture designed by critically acclaimed architects.
Open Google Earth and fly down to Barcelona to see hundreds of 3D models of buildings, monuments, cathedrals, museums, statues, towers and much more. If time was short, my guided tour would probably start at what is arguably the most famous building in the city, the Sagrada Familia. Staying with the cathedral theme I’d head over to the Barcelona Cathedral located in the center of the city. The Casa Milà would be next on my list. This amazing work of art was designated a World Heritage site in 1984.
If modern architecture is more to your liking, you’ll want to visit the Montjuic Communications Tower and the Torre Agbar (which shouldn’t be too hard to find given its unique shape). I could go on, but since a picture is worth a thousand words, we’ve created a short video (above) that showcases many of Barcelona’s most popular destinations. Judging by the thousands of models that users have created using Google SketchUp and Building Maker, I think it’s pretty evident that I’m not the only admirer of this wonderful city.
Posted by Bruce Polderman, Product Manager
City visualizes projects through 3D tours
I recently discovered this news article about the city of Glen Cove requiring 3D tours for all large development project proposals. With this requirement, they hope to gain a better understanding of how projects will impact their community. It's great to see cities using 3D in their community.
Posted by Chris Dizon, SketchUp Sales Team
Cities in 3D Case Study: Fredericton, Canada
Wednesday, March 10, 2010
Cities and local governments around the world are beginning to realize that it takes more than a traditional website to get discovered. Millions of people around the world are touring the planet or searching for businesses through free geospatial tools like Google Earth and Google Maps. Imagery, terrain, and 3D models all help these virtual visitors to formulate a picture in their mind.
The City of Fredericton uses Google Earth for city planning and other official uses. They had access to 3D building data so when they learned about Google's Cities in 3D Program they offered to contribute their data to Google in the hope that it might appear in Google Earth. In addition to Google Earth, 3D data contributed to Google is used to display 3D buildings in Google Maps, which will benefit anyone trying to find a specific location in the City. If you're a city or local government, have access to 3D data, and would like to "get on the virtual map", we encourage you to learn more by visiting our Cities in 3D Program website.
About Fredericton
The City of Fredericton is the riverfront Capital of the province of New Brunswick, which is one of four provinces that make up Atlantic Canada. The population of New Brunswick is around 750,000 with urban and suburban areas extending into rural. The population of the city is 50,535; with a total of 85,688 people living in Greater Fredericton. Fredericton was named the Capital in 1785.
Today, Greater Fredericton is home to more than 70% of New Brunswick´s Information Technology industries. The city is the New Brunswick centre for information technology, engineering and environmental technology industries. Fredericton is also home to two universities (St. Thomas University and the University of New Brunswick) and a variety of training colleges and institutes.
Fredericton offers a balanced lifestyle to its residents, with abundant recreational and cultural amenities. The City is an ISO 9001:2008 certified organization delivering more than 150 programs and services to residents and visitors alike.
Fredericton was added to the Smart 7 Communities List for 2009 by the Intelligent Community Forums - for the second year in a row. Environmental awareness is top of mind for the City of Fredericton. In 2009, the City was named a national leader in the Partners for Climate Protection (PCP) program by the Federation of Canadian Municipalities. Fredericton is only one of four Canadian cities to achieve the highest level of program requirements for greenhouse gas measurement and reduction in municipal operations in Canada.
Other awards and recognitions that the city has won include:
- "Cultural Capital of Canada" 2009 (Government of Canada)
- "Top Five Renovator-Friendly Cities in Canada" 2009 (Canadian Contractor Magazine)
- "Fourth Best City for Families in Canada" 2009 (Who's Your City - Richard Florida)
- "One of Canada's Best Places to Live" 2009, 2008 & 2007 (MoneySense)
- "City of Fredericton National Leader in the Partners for Climate Protection Program” 2009 FCM
Fredericton & Cities in 3D Program
Rob Lunn, GIS Coordinator for the City, told us that he discovered the Google Earth 3D building models and SketchUp utility at the GeoWeb Conference in 2008. City employees were already using Google Earth for work or personal purposes.
Rob Lunn said, "I knew there was a program to upload data to Google and getting data to Google was a big initiative for us. We wanted to find avenues to release available data and information to be public at large and the Cities in 3D Program seemed like a perfect solution."
"We decided to go through the Cities in 3D Program because of time and having Google folks involved helped speed it up. We want our city to be discoverable through Google as well as through our local website. But if there are people going straight to Google, we want them to discover it there too."
History of Sharing
The City of Fredericton has a partnership with the local Military in New Brunswick, Canadian Forces Base Gagetown. The CFB Gagetown is one of the largest military bases in Canada. "We provided data for creating models (building footprints with heights, DEM, aerial photography, oblique angle aerial photography collected by a firm with an ultra light plane and street level photography) and they built up the data sets. The group is the Army Learning Support Center for Tactics School and one of the largest bases in Canada," says Rob Lunn. This high-tech military group took this model and integrated it into a first person tactics game. They wanted a real life model for training purposes.
"We also meet PSAB (Public Sector Accounting Board) legislation for tracking assets. From a city perspective, we have to know the tree cover, quantity of trees, park benches, how many meters of sidewalks, how many meters of sewer pipes, etc. We truly have to know what we have because they have to be accounted for. There's an expense and you have to replace the sidewalk, etc. We have to have a good understanding of what we own."
Fredericton in Google Earth
"Of course, we're interested in promoting Fredericton and have people discover the 3D models, that's wonderful for us. For staff it is important to be able to see the impact that buildings or other structures (e.g signage) have on the streetscape. Right now, we're using the models more for tourism and economic development, but plan to expand into more areas. What motivated us to contribute our data was the opportunity to make the information available to a wider audience through a tool (Google Earth) that they are already using.
Over 100 photo-textured 3D buildings in Fredericton were added to Google Earth in January 2010. The buildings included government offices, commercial buildings and parking structures. To visit Fredericton, download Google Earth and search for "Fredericton, Canada" and make sure the "3D Buildings" layer is checked.
Generating reports from your models
Friday, March 5, 2010
SketchUp Pro 7 can generate tabular reports (fancy lists, basically) from the groups and components in your models. It's a simple operation, and provided you've set things up properly, it can save you a ton of time. Let's look at a pretty straightforward example: a picket fence.
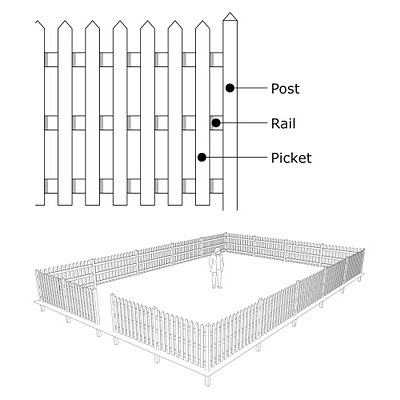
I’m designing a simple wooden fence (SketchUp model) to encircle my yard. The fence is made from copies of three different components: Posts, Rails and Pickets. Here's what it looks like:
I need to know how much lumber to buy, so I use SketchUp Pro to generate a report (File > Generate Report...) in CSV format which I can open in any spreadsheet program. I use Google Docs so that my spreadsheet is online. Take a look at the resulting raw report in its entirety, or view the screenshot below:
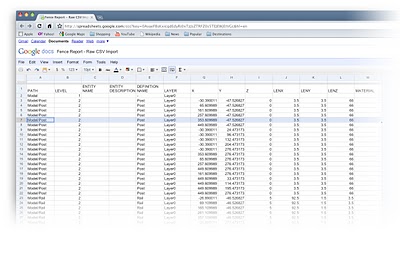 A CSV-format report from SketchUp Pro, imported into Google Docs' spreadsheet tool. (Click to enlarge)
Looking closely at the report, you can see that each component gets its own row, and that each row contains a whole bunch of information contained in a number of columns. Each column represents a different attribute associated with the component; attributes are things like "Definition Name", "Layer" and "LenZ" (length in the Z, or blue, direction).
I'm only interested in using this report to figure out how much wood I need, so I delete all of the attribute columns except the following:
- Definition Name: Tells me which component I'm looking at
- LenX: Tells me the length along the X (red) axis of the component. This is important for my rails, which span horizontally.
- LenZ: Tells me the length along the Z (blue) axis of the component. This is important for my posts and pickets, since it's their height that I'm interested in.
Now my report is a lot easier to look at. To make is even clearer, I rename the columns. LenX becomes "Width" and LenZ becomes "Height". Lastly, I sort by the column "Definition Name" to group each component together. You can look at the complete, simplified report to see the whole thing. A screenshot is below:
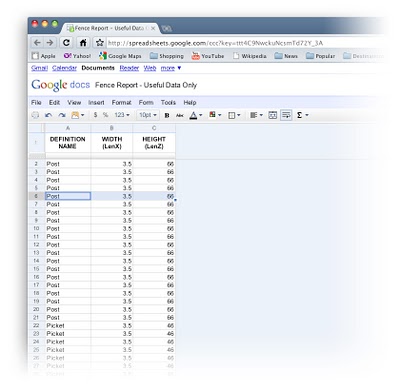 The report after I've deleted unnecessary columns and renamed the remaining ones. (Click to enlarge)
To calculate how many feet of lumber I'll need, all I have to do is sum (add together) the relevant values for each component type:
Posts: Sum all values in Height (LenZ) column for all Post components
Rails: Sum all values in Width (LenX) column for all Rail components
Pickets: Sum all values in Height (LenZ) column for all Picket components
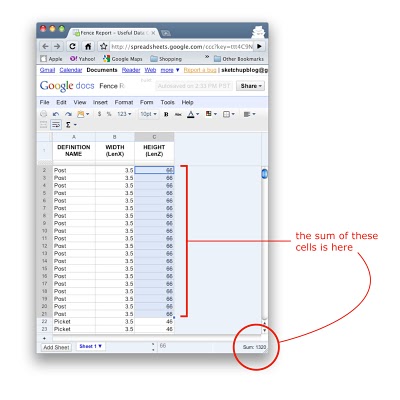 The report lets me easily sum any range of numbers. In this case, I'm figuring out how much 4x4 (3.5 x 3.5, actually) lumber I'll need for my fence posts. (Click to enlarge)
It gets better. Using custom attributes that I can assign with SketchUp Pro's Component Attributes dialog box, I can do even more. I can write a simple formula that calculates area, which would tell me how much paint to buy. I can assign a cost to each component to figure out how much this fence is going to set me back. I can create a new "Length" attribute that takes into account the kerf (thickness) of the saw blade I'll use to cut the lumber. Geeky, but 100% useful.
Stay tuned -- I'll talk about combining report generation with custom attributes in another post in a couple of weeks.
NOTE: Anticipating confusion that might ensue... The horizontal length of my fence's rails will always be LenX (red), even if I turn them 90 degrees so that they're actually oriented in the Y (green) direction. Why? Every component has its own set of axes. The width of Rail extends along the X (red) axis for that component, so I can always know its length by looking at its LenX value. Please use the comments for this post to let me know if I'm not making any sense.
Posted by Aidan Chopra, SketchUp Evangelist
Modeling California’s Carnegie Libraries
Thursday, March 4, 2010
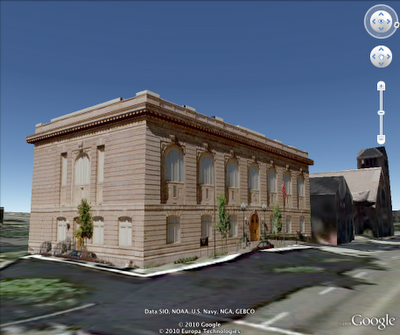 Oakland Main Library modeled by Jax
I had the opportunity to interview Jax via email, and I’d like to share this conversation with you:
How would you describe your project?
Our project, 3D Carnegie, could best be described as a "Test Case." Being that at the very core of the idea is a learning curve on refining how one, from a remote location gathers enough information, or has a method to get others to gather information to model accurately enough for that model to be accepted as part of the Historic Record.
What are the goals for your project?
First goal is to add enough value to the idea and concept to get the attention of the historic community, and have the 3D modeling technology accepted as viable historical information. Secondly, would be to find funding streams for R&D, and develop this into a true working, acceptable program that will make our historic record more interactive and information rich. Thirdly, in pertaining to the Carnegie Collection, some form of graphical 3D representation of present and existing Carnegie library buildings, before they are all gone.
What tools are you using to create the models?
Google SketchUp, Google Earth, gathering and communicating with modelers from all over the world with a Google Group page. We have a Google site page up showing some graphics and actual photos of the completed models. Information and presentation of the project is where we really need some help, not to mention more active modelers.
How would you define "success" for your project?
There are just so many areas where this type of program could be applied:
- Bringing awareness to a restoration project for a community that needs to restore their old Carnegie, or any other historic building.
- Promoting one's downtown area by modeling their historic buildings.
- Creating an interactive, information rich historic record for research, or for future generations to enjoy.
If any one of the ideas mentioned above were to be realized, or at least bring more awareness of the use of 3D modeling for this type of application I would call our project successful. I want to see them all implemented!
If I were to nail it down to one main thought, I would say this: 3D modeling with SketchUp and Google Earth can allow more people to be a part of adding value to the historic record of our nation, at a time when funding for these types of programs are in jeopardy.
If you’re interested in helping Jax with this project, feel free to visit his collection on the 3D Warehouse and click “Contact the owner” below the description.
Posted by Tommy Acierno, SketchUp Help Team Lead
Athens, Greece in 3D
Monday, March 1, 2010
No knowledge is ever wasted. In college I took three semesters of Greek civilization because I thought it was nifty (and apparently I also had some plan involving never graduating, but that eventually fell through). Although this makes me more fun at parties than I'd otherwise be, I have had no practical use for the information. Until now!
We're pleased to announce the addition of Athens, Greece to the 3D Buildings layer in Google Earth. No trip to virtual Athens would be complete without a visit to the Parthenon. The architecture of the Parthenon is fascinating; all of its lines exhibit subtle curvature (the columns, for example, are slightly convex) in order to avoid the optical illusion of concavity resulting from parallel lines viewed at a distance. While you're on the Acropolis, duck over to the Herodeion Theater, where for almost two thousand years music and theater performances have been held -- check out its schedule during the Athens Festival.
With the 2010 Winter Olympics in progress, naturally the site of the revival of the modern Olympics comes to mind. The 1896 Summer Olympics were held here; also, check out the Athens Olympic Stadium and sports complex constructed for the 2004 Summer Olympics. If your tastes run more towards archaeology, there's the Archaeological Museum, where you can see the Antikythera Mechanism among many other artifacts. Count on a geek to be interested in ancient mechanical computers...
Enjoy!
Posted by Allison Floyd, Software Engineer
